What A1c measures beyond single glucose readings
You can have a week where your meter looks “pretty good,” and still walk into a lab visit feeling like the number on the printout belongs to someone else. Part of the mismatch is that A1c isn’t reacting to today’s reading or even yesterday’s—it’s reflecting what your blood sugar has been bathing your red blood cells in, day after day.
As glucose circulates, a small amount attaches to hemoglobin inside red blood cells. Those cells stick around for a while, so the lab is essentially sampling a mixed crowd: some cells are newer and haven’t had much time to pick up glucose, while older ones have been exposed longer. That’s why a few “great” days can feel invisible, and a stretch of higher numbers—especially after meals or overnight—can quietly pull the average up even if your spot checks miss it. A1c is less a snapshot and more a smear of many ordinary days, with the messy parts included.
Why three months is an approximation, not a guarantee

It often hits in the waiting room: you’ve been walking after dinner for two weeks, you’ve cut back on the late-night snacks, and you’re already bracing for the lab to “show it.” Then the A1c comes back and barely moves, or moves the “wrong” way. That’s where the three-month idea trips people up—it’s a helpful shortcut, not a promise.
Red blood cells don’t all age out on the same schedule. Your A1c is weighted toward the more recent weeks because you have more younger cells than very old ones, but it still includes cells that lived through the higher-glucose stretch before you made changes. If your routine shifted only recently, the newer, less “glucose-tagged” cells may not be a big enough portion of the mix yet. And if something changes how quickly you make or replace red blood cells, the timeline can feel even less predictable.
When numbers disagree: A1c versus fingersticks and CGM
It can be a little disorienting when your fingersticks are mostly in range, yet your A1c still suggests a higher average. Part of it is simple timing: most checks happen around meals, while a lot of glucose exposure can pile up in the quiet hours you don’t measure—overnight drift, early-morning rises, or the long tail after a higher-carb dinner. If you only see a few dots on the map, the lab is still counting the parts you never plotted.
CGM can help, but it adds its own kind of confusion. The sensor is estimating glucose in the fluid between cells, not directly in the bloodstream, and it can lag during fast changes—like right after exercise or a quick correction. Compression while sleeping and calibration quirks can also make a “pretty” graph look better than your body’s true average. When A1c and daily data don’t line up, it often points less to a single bad day and more to a pattern that’s easy to miss.
Hidden biology that can skew A1c results
Sometimes the confusion starts with a small detail you’d never think to connect to glucose—like feeling unusually tired, donating blood, or starting an iron supplement—and then an A1c result shows up that seems out of character for your recent readings. That’s because A1c isn’t only influenced by glucose; it also depends on how long red blood cells are hanging around to collect that “glucose tagging” in the first place.
If your body is replacing red blood cells faster than usual, the lab may be looking at a crowd that’s younger on average, which can make A1c come back lower than your daily numbers would suggest. If red blood cells are sticking around longer, A1c can drift higher even without dramatic spikes. Iron deficiency, recent blood loss, certain anemias, kidney disease, and some hemoglobin variants can all nudge results in ways that feel unfair—like being graded on a curve you didn’t know existed. When the mismatch persists, it’s often less about willpower and more about this background biology quietly changing the math.
The expectation trap: “I changed last week” confusion
It often shows up as a small, stubborn disappointment: you’ve been doing “the right things” for ten days, your after-dinner numbers look calmer, and you start mentally rehearsing the win you expect at the lab. Then the A1c arrives with a shrug, as if none of it counted. That gap between effort and feedback is the expectation trap—assuming a recent change should register immediately in a test that’s built to blur time.
Even when today’s readings are improving, many of your red blood cells were already “tagged” during the weeks before the shift, and they’re still in the sample. So the result can feel like it’s grading the old routine, not the new one. It also doesn’t help that change is rarely clean: weekends, travel meals, stress, and sleep debt can sneak in extra exposure that a few spot checks don’t capture. If the new pattern holds, the lag usually becomes easier to tolerate—because the trend, not the instant payoff, is what A1c is best at showing.
Interpreting A1c ranges without oversimplifying targets
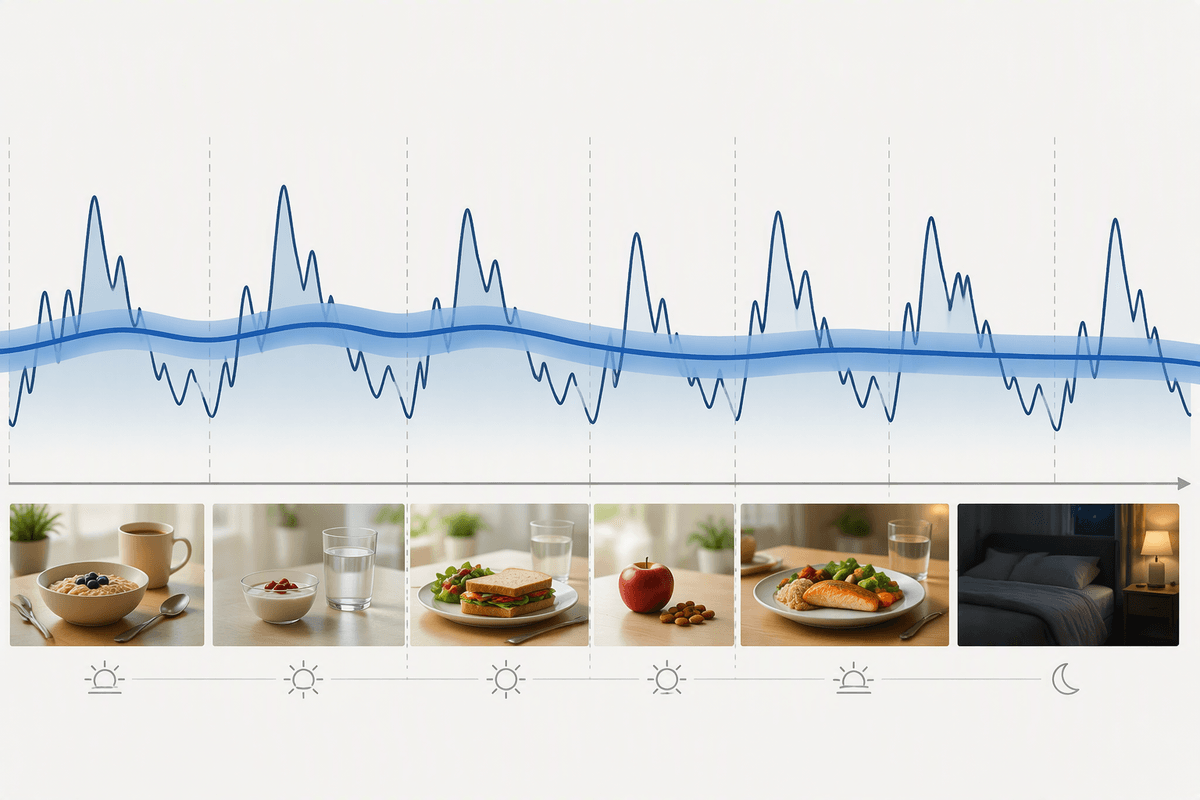
Somewhere between the lab printout and the drive home, it’s easy to turn a range into a label: “good,” “bad,” “failing.” But A1c ranges aren’t describing your effort so much as your recent glucose exposure, averaged and blurred. Two people can share the same A1c for very different reasons—one with steady mid-range numbers, another with frequent lows and spikes that cancel out on paper. That’s why the number can feel oddly calm even when your days haven’t been.
Targets also don’t behave like speed limits where one decimal point changes the whole story. A shift from 7.2 to 7.0 may reflect real progress, or it may be normal variation in the lab and in your body’s red-blood-cell turnover. What tends to be more useful is the direction over time and whether your daily data matches the “shape” of that average—post-meal climbs, overnight drift, or long stretches that quietly push the baseline up.
Using A1c as feedback, not a report card
Sometimes the sting isn’t the number itself—it’s how quickly it turns into a verdict. You remember the walks, the smaller portions, the “no thanks” moments, and the A1c still lands like a grade. But A1c is a summary of exposure, not a character assessment, and it’s often reporting on weeks that didn’t feel dramatic day to day.
It can help to treat it like a trail marker: it tells you whether the overall path is drifting up or down, even when the daily readings feel noisy. If fingersticks or CGM are improving but A1c hasn’t caught up, that may simply mean the older, higher-glucose weeks are still in the mix. And if A1c is higher than you expect, it’s usually a prompt to look for the quiet contributors—overnight trends, post-meal “tails,” or inconsistent days that don’t show up in a few checks. The useful question becomes, “What pattern is this reflecting?” not “What did I do wrong?”




![Best Cash Alternatives [Get Yield on Short-Term Investments]](static/image/2026/08/03/87e885cb-e070-4bb6-902b-704f3bb1fb84.png)